Posted on
November 13, 2025 by
The VRG Blog Editor

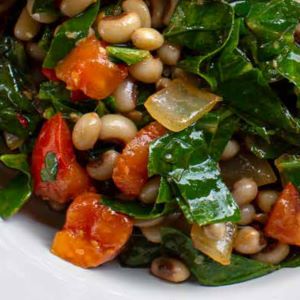
photo from Taco Vegana
The Vegetarian Resource Group maintains an online Guide to Vegan/Vegetarian Restaurants in the USA and Canada. Here are some recent vegan restaurant additions. The entire guide can be found here: www.vrg.org/restaurant
To support the updating of this online restaurant guide, please donate at: www.vrg.org/donate
Here are some new additions to VRG’s guide:
Dialogue Coffee and Flowers, 188 Allen St., New York, NY 10002
Dialogue Coffee and Flowers is a vegan café and flower shop. Specialty coffee beverages include strawberry matcha latte, fermented rice osmanthus latte, and carrot cake latte topped with a carrot cake cold foam. Plant-based milk options include oat, almond, soy, and coconut. Vegan pastries are also available including croissants, banana and walnut muffins, pain au chocolat, and Nutella cream cheese bomboloni.
Electric Beets, 158 7th Ave., Ste. B, Brooklyn, NY 11215
Inspired by her own journey, the founder of Electric Beets hopes to create a nutritious experience that brings joy. They list ingredients and many gluten-free items. The menu changes often and availability varies. Seasoned, Breakfast Burrito offers tofu, sweet potato, spinach, onion, sunflower seeds, carrots, and more in a tomato-wrap. Savory Baked Goods include Basil Biscuit and Spinach Ricotta Scone and more. Spring Rolls are seasoned tofu-based with sweet potato noodles, rice paper wrapper, cucumber, bell pepper, cabbage, carrots, sesame seed, mint, spinach, and choice of Peanut or Sweet Chili Sauce. Jack al Pastor is a GF wrap, pineapple, brown rice, Jackfruit, onion, sweet potato, cabbage, raisin, Chipotle pepper, adobo, sunflower seed, and Tahini. Crunchy Veggie Peanut Salad combines cabbage, cucumber, carrot, quinoa, Bell Pepper, peanut butter, and peanuts in a tamari, sesame, Gochujang sauce. Their namesake, Electric Beets features walnuts, coconut yogurt, spinach, cashew, basil, chickpea miso, lemon, coriander, and cardamom. Curried Cauliflower seasoned with coriander, turmeric, cumin, ginger, carrot, mint, and red pepper, also has raisins, pepitas, coconut yogurt, and cucumber. Tamari-seasoned Japchae Sweet Potato Rice Noodles showcase red bell pepper, carrots, shiitake mushroom, spinach, scallion, wood ear mushroom, ginger, and sesame seeds. Lasagna Slice is crafted with tofu, cashew, semolina or GF noodles, mushroom, garlic, Italian Seasoning, and basil. Sunflower Mac & Cheese Noodles (Semolina or GF) are crafted with sunflower seeds. Beet Burger is made with mushrooms, brown rice, horseradish, and other seasonings. Enchilada encases sweet potato, mushrooms, tomatoes, beets, brown rice, sunflower seeds, Chipotle, and cilantro. They also have seasoned, cremini mushroom sausage and tofu nuggets. Grab-and-Go Soup stock varies widely but potentially there’s Chili, Egyptian Lentil, Cheesy Broccoli, Chickpea Curry, Peanut Stew, Mushroom Barley, Corn Chowder and more. If dining on site, see the Hot Menu Calendar of Daily Soups. Sweets may include Lemon Blueberry, Corn, Pumpkin Muffins and more, as well as Banana Pudding, chocolate Sunflower seed-based Sun Cups, Sesame Tahini Cookie, chocolate Zucchini Brownie, chocolate Bliss Bark with dates, almond and dried cranberries, Peppermint Patty, and more.
Taco Vegana, 1004 Oakwood Ave., Richmond, VA 23223
The philosophy at Taco Vegana is “This goes beyond the menu; it’s about protecting the integrity of a cuisine, acknowledging where recipes come from, and spreading kindness to all living things…” For starters there’s Elote Loco Mexican street-style corn with cotija, chipotle mayo, takis/tajin powder, and crema; Taco Vegana’s Guac with tortilla chips, cilantro and limes; their Asada /Chi’ken Fries with refried pinto beans; their tex-mex queso, pico, crema, pickled jalapeños, and avocado salsa; as well as other dishes. There offer several tacos such as Al Pastor with adobo, pineapple, onions, cilantro, and avocado salsa; Veggie Taco with sweet potato, onion, corn, bell pepper, black beans, cilantro, crema, and Pico; as well as Papas (Potato) and Soyrizo with Pico, and crema—to note just a few. Enchiladas showcase Green, Red or Mole sauced corn tortillas filled with mashed potato/cheese. Burrito Bowl has rice, black beans, sweet potato, bell peppers, onions, corn, avocado salsa, crema, and lettuce. Both have the option to add a protein. They list several gluten-free options across the menu. Their dids menu features Tacos, Quesadillas, Nachos and Chi’ken Tenders with Fries. Sweets include traditional Mexican Churro Bites with brown sugar and cinnamon served with a dark chocolate dipping sauce and 3 Leches Cake–Vanilla cake served with condensed soy, almond and oat milk, vegan frosting topped with cinnamon, and seasonal fruit.
Urban Beets Cafe & Juicery, 5091 W. Brown Deer Rd., Brown Deer, WI 53223
Urban Beets Cafe & Juicery offers an abundant menu motivated by concern “for animals…health benefits, and… love of our natural world….” They even provide an ingredient breakdown of their Burgers, Frittata, Sausage and Chicken. All day Breakfast features Free Bird Chickpea Frittata with avocado; Coconut Bacon on an English muffin; Pesto Perfection with Chickpea Frittata; and Pesto and spinach on Sourdough Bread. Sun Up Ciabatta showcases sausage, frittata, cucumber, spinach, cheese, and Spicy Ranch. French Toast Casserole is bread soaked with oat milk and spices, baked and topped with the flavor of the week as well as your choice custom topping like Banana and PB with Choco Drizzle or Apple Cinnamon Sugar and more. Besides Bowls and Salads, here are some of the many Entrées. Pesto Mushroom Melt is marinated Portobello, White bean Pesto, tomato, spinach, pickled onion, spinach, and Cheddar on Ciabatta. Rueben Tender offers oven roasted beets on marble rye with sauerkraut, Swiss, and Russian dressing. Jamaican Jerk Tacos are 2 flour shells, Jerk Plantain, avocado, red pepper, cabbage, Mango Salsa, and Mojo Dressing. Harvest Stack layers Sweet Potato, Tempeh Bacon, Red onion, Arugula, and Horseradish Mayo on Rye. Taco Mac Pasta is crafted with Chickpea Walnut Chorizo, cheese Sauce, tomato, avocado, Jalapeño, and Spicy Ranch Drizzle. Coconut Curry combines chickpea, potato, tomato, onion, Curry, Masala, and cilantro over Rice. Gyro Chicken Salad serves up Marinated “Chicken,” Harissa Hummus, cucumber, salad fixings, Feta, and Cashew Tzatziki. For dids there have Tacos, Mac & Cheese, Buttered Noodles, Grilled Cheese, Juices, Smoothies, and more. As the name would imply, they have all sorts of Juices and Smoothies like Mango Lassi or Mane Magic–Banana, Peanut Butter, Coffee, Lions Mane, cinnamon and agave and many others. There’s also a plethora of hot and cold Coffee and Tea Drinks like Cherry or Lavender Chai, Maple Pumpkin Cold Brew, S’mores Latte with Chocolate, Toasted Marshmallow, Graham Cracker, Milk and Espresso, Gingerbread Latte with Caramel Drizzle and Espresso, Caramel Pumpkin Latte Espresso and Cinnamon Streusel Latte with blueberry, almond and cinnamon to name a few. Milk choices are oat, coconut or almond.
Urban Jungalow, 1910 W. Cass St., Tampa, FL 33606
Urban Jungalow lists their ingredients! While the menu may vary, possible Made to Order items are Breakfast Sandwich, noted as a “café favorite on your choice of toasted bagel, tofu egg patty, tempeh bacon, and sauce. There’s also Bagel & Schmear—your choice of Bagel and spread, or a toasted Bagelwich with Carrot Nova & Chive Creamed Cashew Cheese, Hearts of Palm Salad spread, and more, as well as tomato, capers, and pickled onions. Focaccia Pizza is deep-dish sourdough with marinara and vegan mozzarella. Pulled BBQ Sandwich offers a “homemade” brioche bun, shredded BBQ tofu, coleslaw, and BBQ sauce. Listed as a “house favorite,” 1925 Caesar Salad—showcases kale, creamy dressing, “homemade” sourdough crumble, sunflower seeds, cashew parmesan, tofu nuggets, and pickled red onion. Two savory Baked Goods are their Truffle Mushroom Sourdough Focaccia topped with king trumpet mushrooms, caramelized onion, thyme, and truffle oil and their Tomato Herb Sourdough Focaccia topped with tomatoes, basil, olive oil, and sea salt. You may choose a dipping sauce too. Sweets include Pumpkin or Cranberry Orange Pistachio Muffin, frosted Chocolate Protein Donut, and Harvest Brownie made with sweet potato and almond butter. Some Desserts are Berry Cherry Crumble layering cherries and blueberries with oat crumble and topped by dairy-free whip; Key Lime Pie with a dehydrated lime garnish; and Adaptogenic Peppermint Cups—a chocolate mushroom, blue spirulina blend. There’s also a Coconut version with almonds. Besides numerous Coffee Drinks, they craft Functional Beverages like hot or cold Mushroom Chocolate. Mint Condition features fresh mint, ginger, and club soda. Seasonal Iced Blue Lavender Matcha blends matcha, butterfly pea flower, and lavender agave. For all drinks containing milk, choose: Oat Milk, Almond, Pistachio, or Soy. Among several Grab N Go items there’s Tandoori or spiced African Peanut Hummus; sweet, savory Crunchy (tofu)Teriyaki Roll; and Gochujang Bulgogi Roll with gochujang mushrooms and carrot. Both Rolls have avocado and mango and are wrapped in rice and nori, served with tamari. Hawaiian Poke Bowl offers rice, cucumber salad, edamame, carrots, homemade beet “tuna,” mango, teriyaki tofu, avocado, and sesame seeds.
Vegan Express, 98 Niagara St., Unit B, St. Catharines, ON L2R 4L4 Canada
Vegan Express hopes to “…inspire people to choose a …greener, more compassionate lifestyle” as they celebrate their belief in the health benefits of a plant-based diet including whole foods and organic ingredients. Salads include crunchy Cabbage Salad with lemon mint dressing, Tabouli Salad, Fattoush– mixed vegetable salad, lime vinaigrette and “homemade” pita chips, and others. To name a few of their soups, there’s Brown Lentil containing olive oil, onions, garlic, spinach, mint, “handmade” noodles, and lemon; Tomato soup based Kidney Bean Stew; and Butternut Squash Soup with apples, carrots, and other veggies. Some of their wraps are Quinoa Bean Wrap Taco Style with beans, corn, onion, mixed vegetables, taco seasoning, and vegan cheese; Zaatar and Vegan Cheese Melt on “fresh in-house made naan bread;” and Falafel Wrap–Pita bread, falafels, lettuce, tomato, cucumber, onions, tomato, and tahini sauce. They offer a Veggie Burger too. A few of their Mains are Turmeric Rice with Mixed Vegetables and almonds; Chick Pea Bulger with Tomato; veggie Hummus Bowls; and more. Check their website or Facebook for daily specials too. One of several sides is Potato Tartare—seasoned Sweet potato, bulgur, pine nuts, pepper, and tomato topped with parsley, onion and sumac. Dessert choices are Coconut Macaroons, Turmeric Anise Cake, or Baklawa (Baklava)—layered filo pastry, filled with chopped nuts and syrup. You may also order Cakes with advance notice.